The data you need to
follow fish status and development
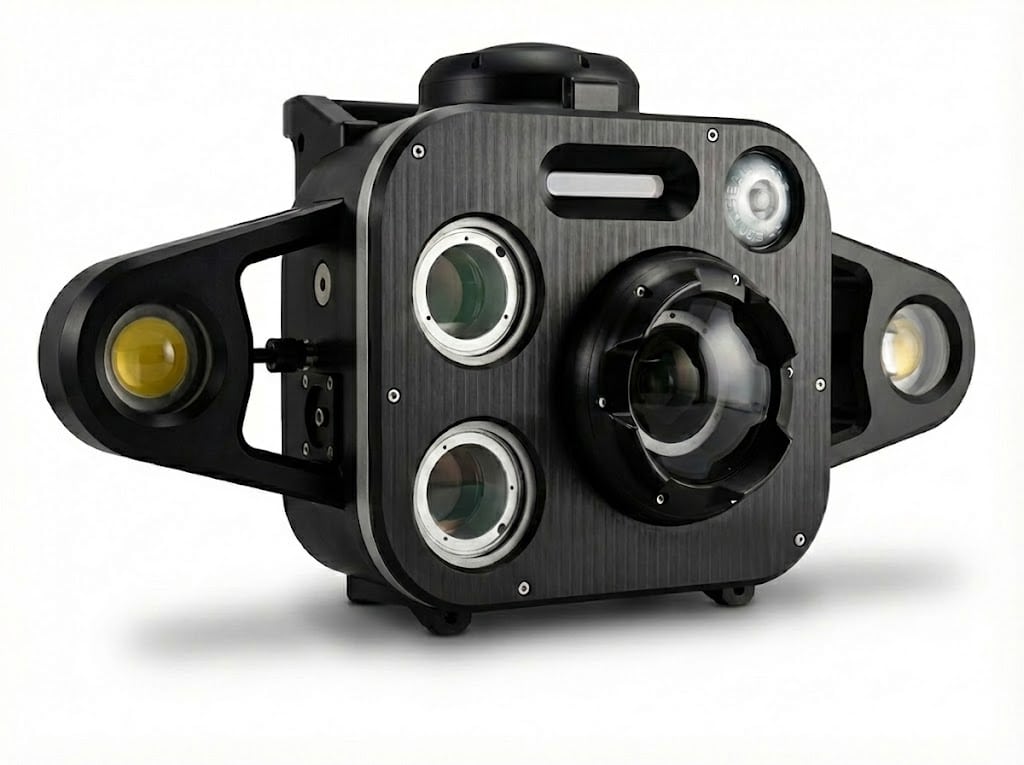
Bioscope 3.0 – less manual work and more control
One camera. More answers that matter.
Bioscope 3.0 gives your team a clearer picture of fish development throughout the entire production cycle. With high image quality, a smart winch, self-cleaning lens, relevant environmental data and continuous measurements, you get insight that is easy to follow up in daily operations.
Built for stable operation at sea — with less need for manual follow-up and more functions gathered in one robust unit.
“A camera in the cage is our daily eyes on the fish.”
— Stein Johansen | Site Manager, Lerøy Aurora
The Bioscope
How the Bioscope works
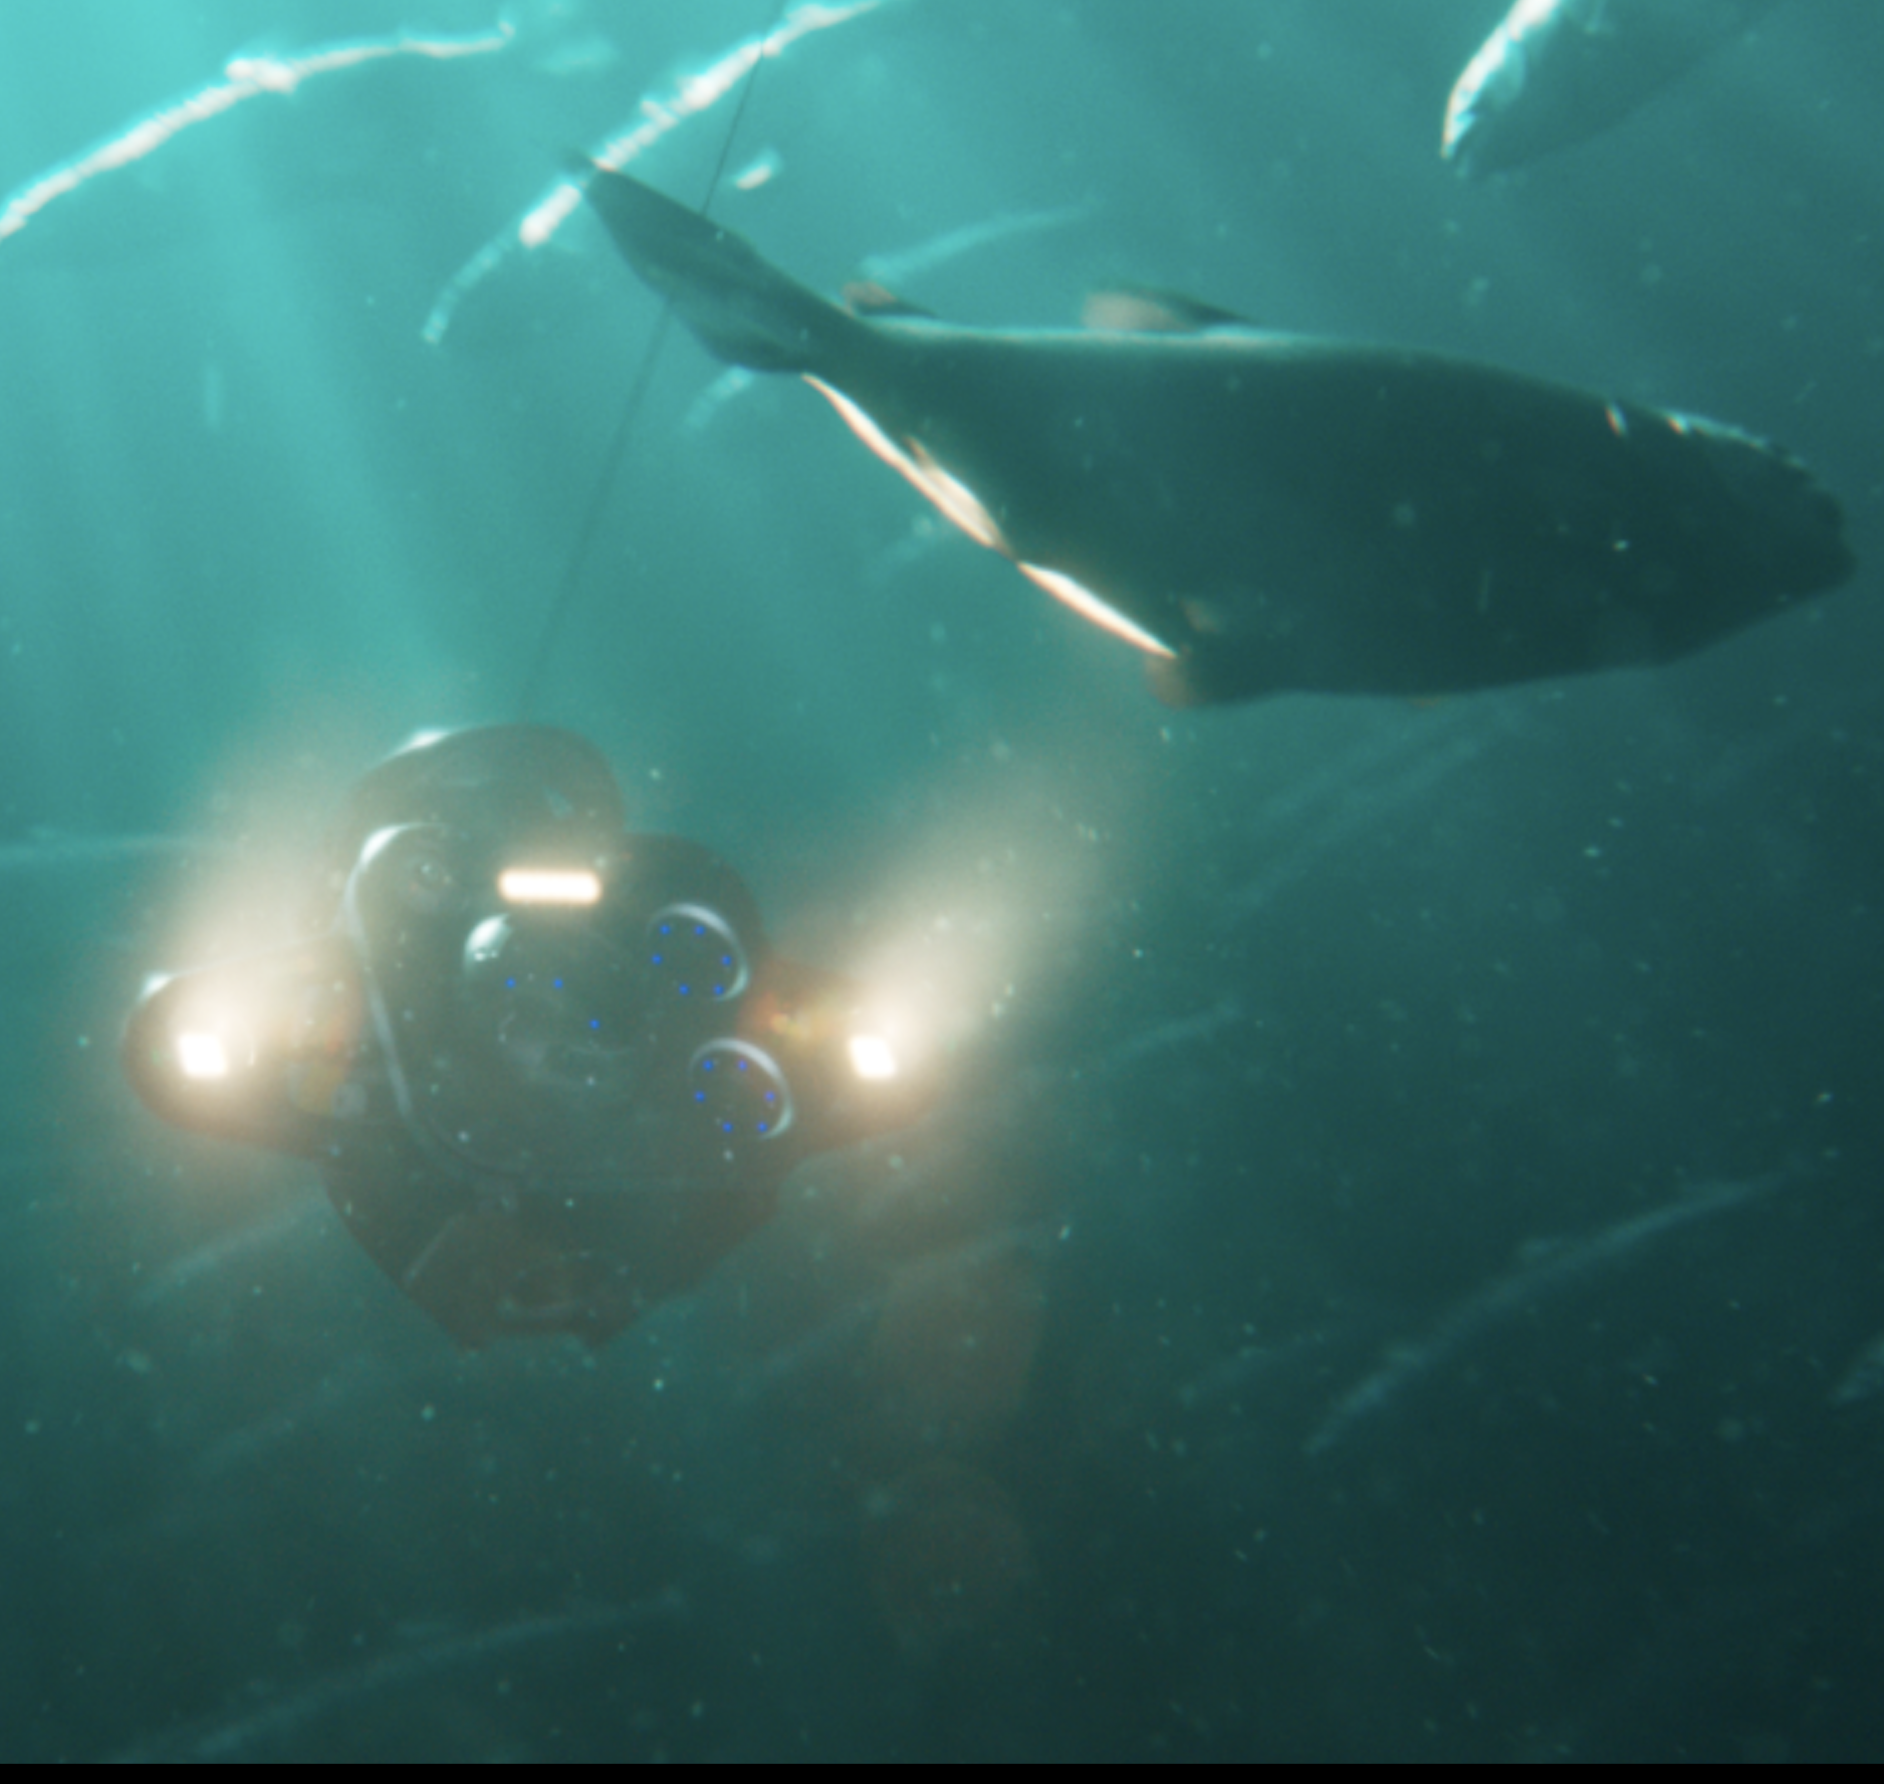
After a simple plug-and-play installation, the Bioscope can deliver up to 60,000 approved measurements every day.
Easy installation
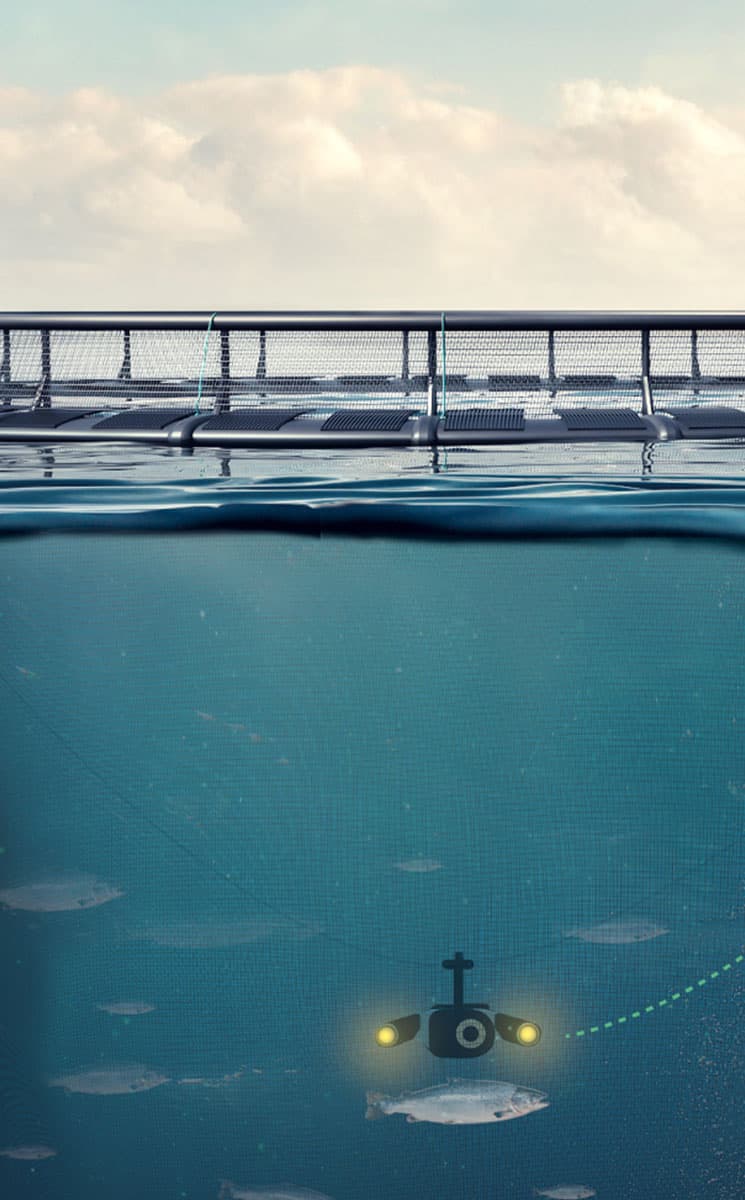
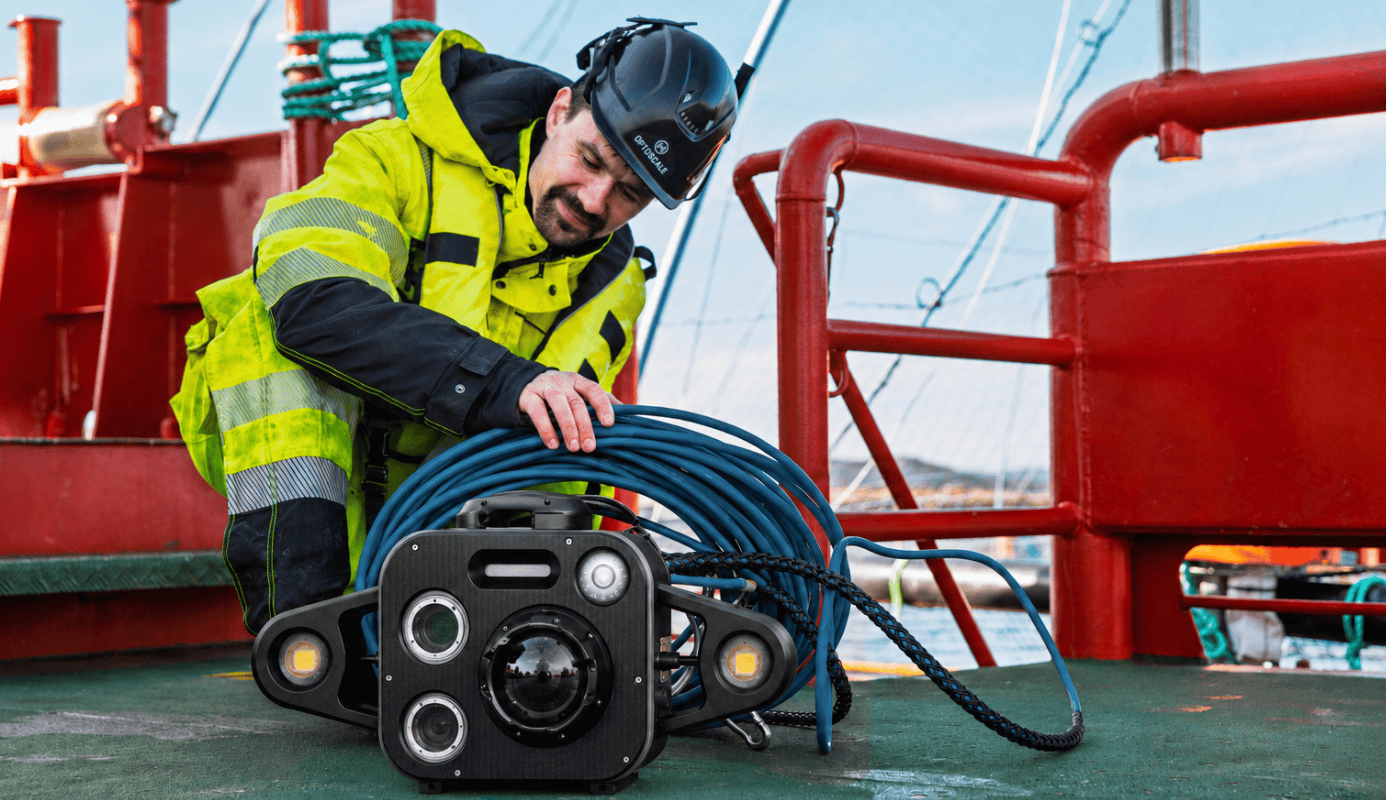
Our bioscopes are built with plug-and-play functionality, making installation quick and efficient. This reduces the need for extensive cabling and complex configuration, so you can start monitoring the cage faster.
This saves valuable time and resources — both during setup and in daily operations.
Flexible between cages
Another advantage of plug-and-play is that the Bioscope can easily be moved between salmon cages when needed.
This is ideal when you want to monitor and follow up across several sites, without having the equipment tied to one fixed position.
Precise data — even without network coverage
With Edge Computing technology, data can be processed directly in the Bioscope, where the measurements are collected. This means the Bioscope does not depend on stable coverage or continuous network access to keep collecting data.
This gives you continued access to new and precise data on weight, health status and lice counts. When the network is back, the data is uploaded automatically, giving you a solid basis for fast, informed decisions throughout production.
Simple installation
Simple installation and operation make everyday handling easier for the site team.
Plug & Play
The system comes ready to use and automatically starts sending data once deployed at sea.
Reliable Reporting
Reporting up to 60,000 approved measurements per day per unit provides a solid basis for accurate reporting on biomass, health, behaviour, lice and feeding.
Strong Integration
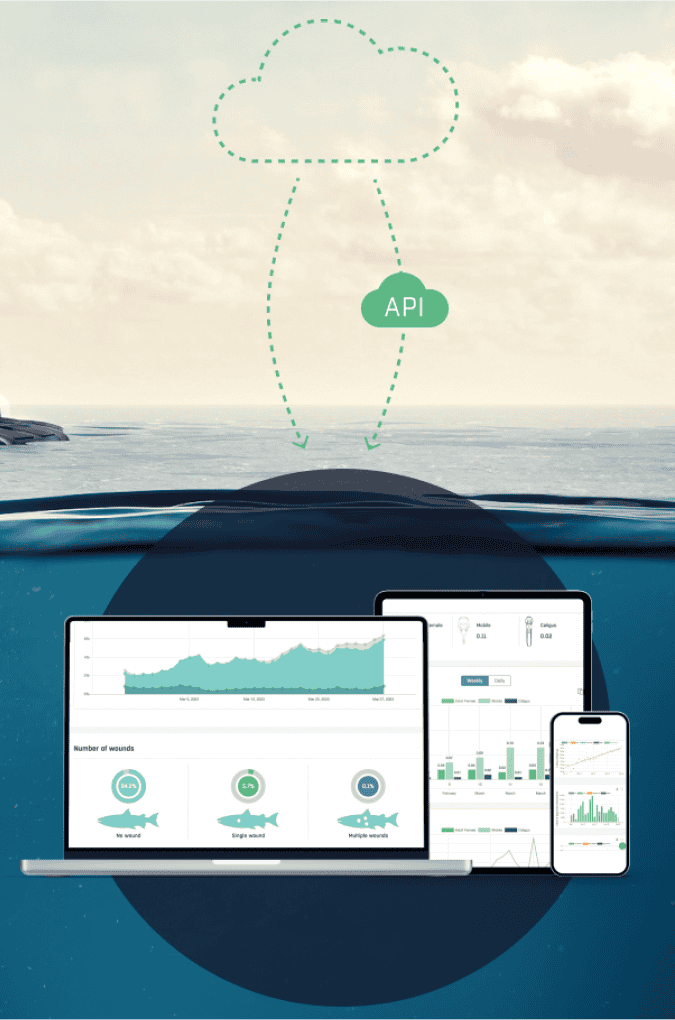
Access data through APIs for integration with your own analytics and management systems.
Top-notch Customer Support
A dedicated customer contact helps ensure stable operation and the right understanding of the data basis.
Real-time analysis
Easy access and an intuitive user interface for real-time analysis give you a clear understanding of the situation and a solid basis for action.
Edge computing
Reliable data, when you need it
We deliver technology that lays the foundation for more precise monitoring, smarter decisions and better control in aquaculture production.
Processing power directly in the Bioscope
OptoScale is a leader in the use of Edge Computing technology in aquaculture. By placing advanced data processing directly in the Bioscope, large amounts of image and sensor data can be analysed where the measurements are collected.
This enables faster and more precise data analysis, making important information on lice levels, weight and health parameters available without delay.
Insight while it happens
With Edge Computing, advanced algorithms and artificial intelligence can be used in real time. This makes it possible to detect early signs of disease, assess growth potential and optimise feeding strategies for better growth and health.
Data that can be shared further
Another major advantage is data sharing. Through our open APIs, the data can be integrated into the software you already use.
This makes the insight easier to use in daily operations — whether you are following development in one cage or across several sites.
Get the full overview in OptoScale’s web portal
OptoScale’s user-friendly web portal gives you updated insight into salmon development — across weight, health, lice, behaviour and feeding.
Everything in one place
In the web portal, you get graphs, trends and updated measurements that make it easier to follow development in the cage over time. You can see the status of weight, health and lice counts, and quickly understand whether production is developing as expected.
Every time you log in, you get an updated picture of the situation — not just a snapshot.
See the fish for yourself
You get access to high-resolution images and can carry out your own inspections directly in the portal. Zoom in, assess the status and follow development without taking the fish out of the water.
This makes it easier to detect patterns, trends and deviations — whether you are following one cage, several cages or the entire site.
From Data to Decision
The information is presented in a clear and easy-to-understand way, so you can quickly see what needs follow-up. This gives you a stronger basis for actions, prevention and planning throughout production.
You can also generate harvest estimates, report weight and quality to the processing plant and sales team, and download data in Excel or CSV format.
Better control in daily operations
Altogether, the web portal gives you a better overview of production, fewer manual steps and a stronger basis for good decisions — both in daily operations and future planning.