Quality in every class.
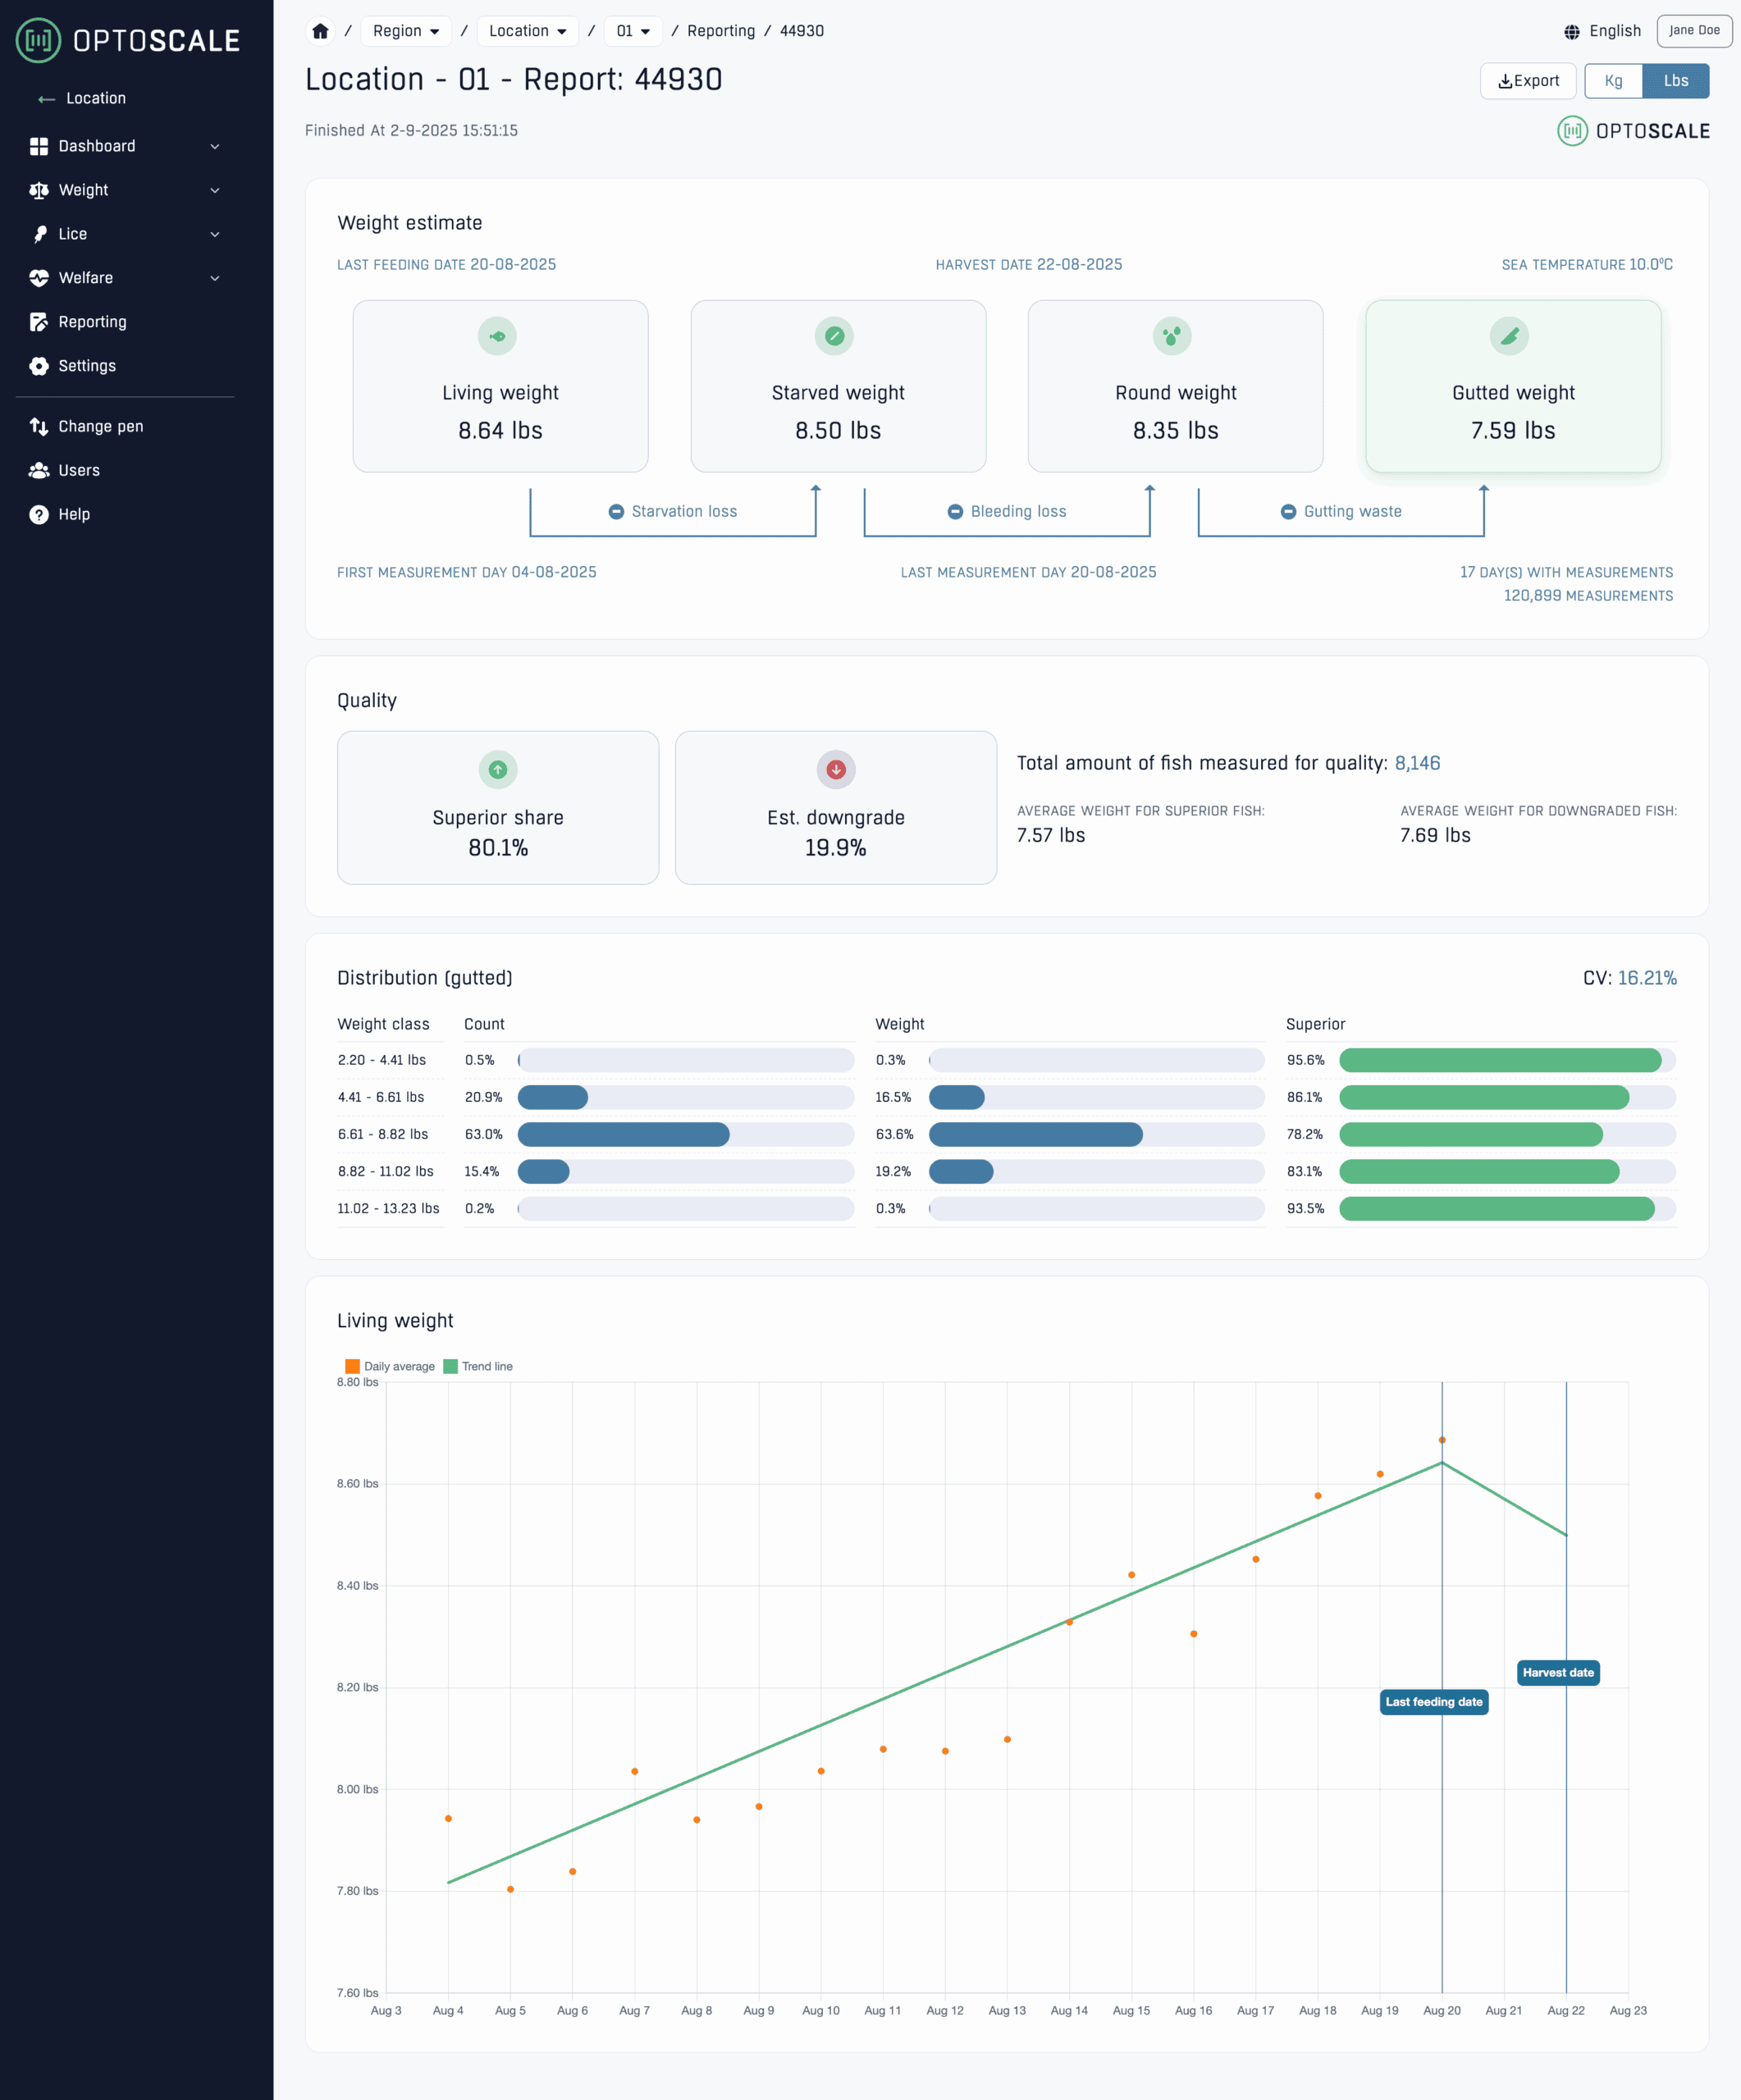
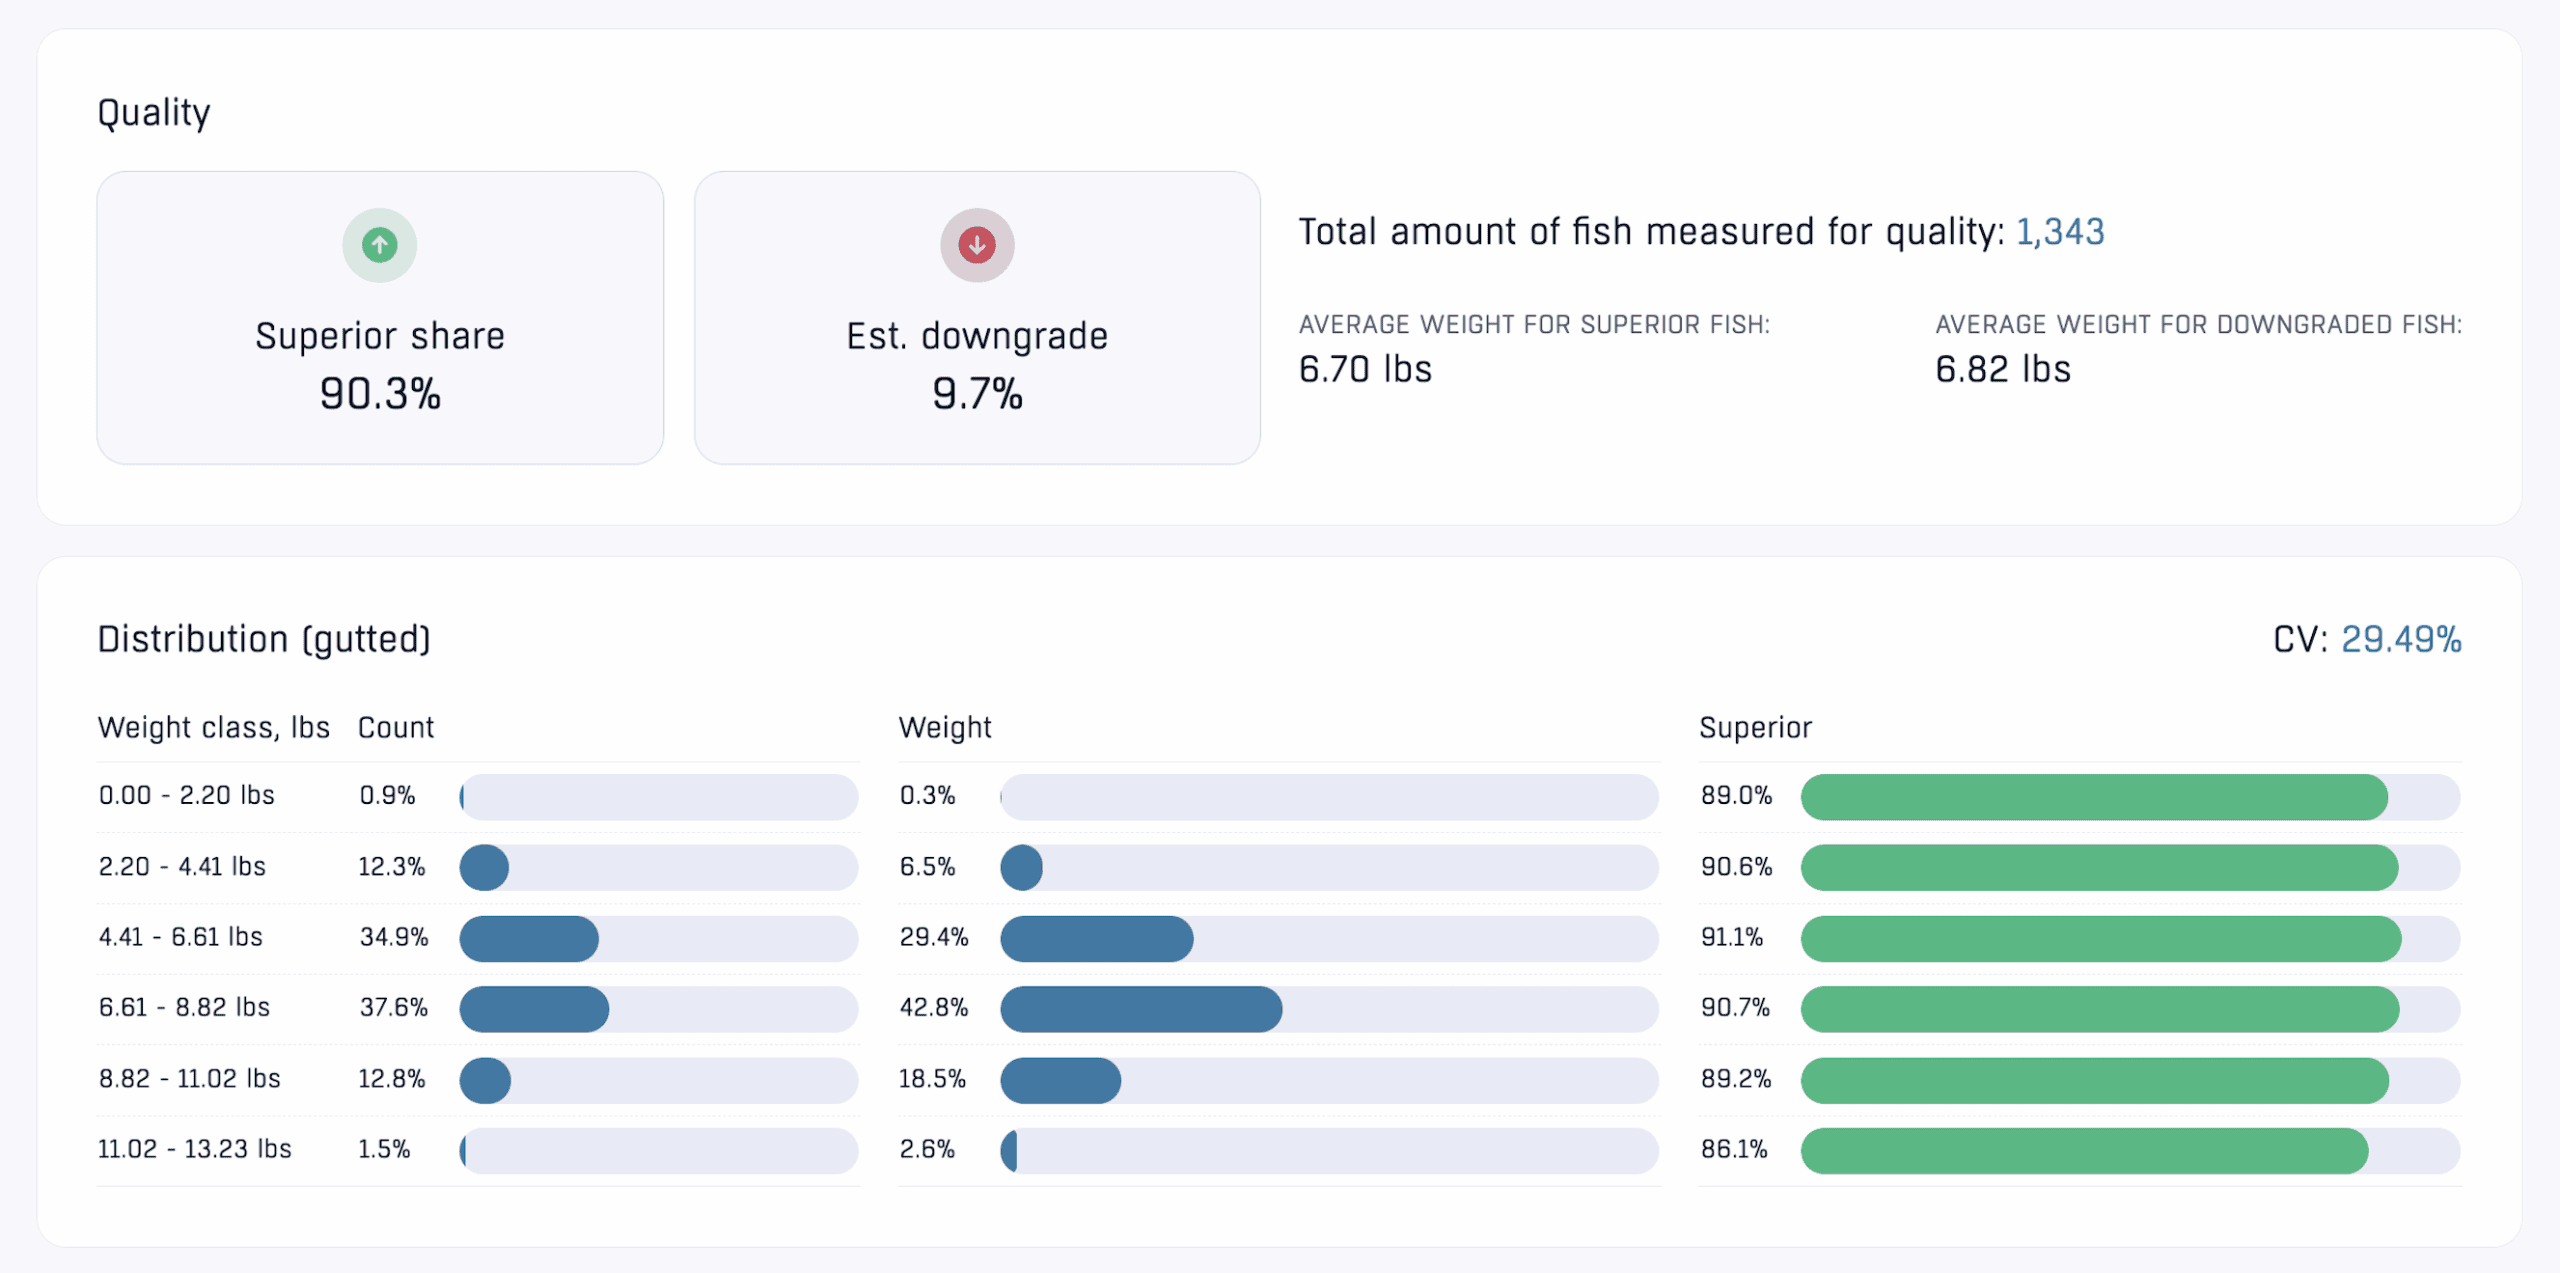
The wait is over. Now you can see quality by weight class – which groups deliver the highest superior share and where downgrading is hiding. With a precise overview, you can plan harvest and sales with accuracy that makes a difference. Easier choices, better margins.
See where the value lies
Not all fish are the same – and not all weight classes deliver the same quality. With the new quality report, you can see exactly where the value lies. It gives you control over which batches are the most profitable and makes it easier to extract maximum value at harvest.
✓Superior and downgrading – by weight classSee where the superior share is highest and prioritize the groups that deliver the best return.
✓Downgrade estimates – easy to followCatch changes early and adjust plans before harvest.
✓One quality reportAll figures in one place – ready for reporting and sharing.


Plan with precision
Harvest planning is all about timing and market. With quality estimates per weight class, you can see which classes deliver the best return and plan logistics and sales more effectively. Greater predictability makes decisions both easier – and safer.
One report. Many answers
The report gives a complete overview of the group’s quality: superior share, downgrading, and distribution per weight class. Its clear structure makes it easy to understand the situation, document decisions, and submit a solid entry.


Bioplan – from documentation to decision
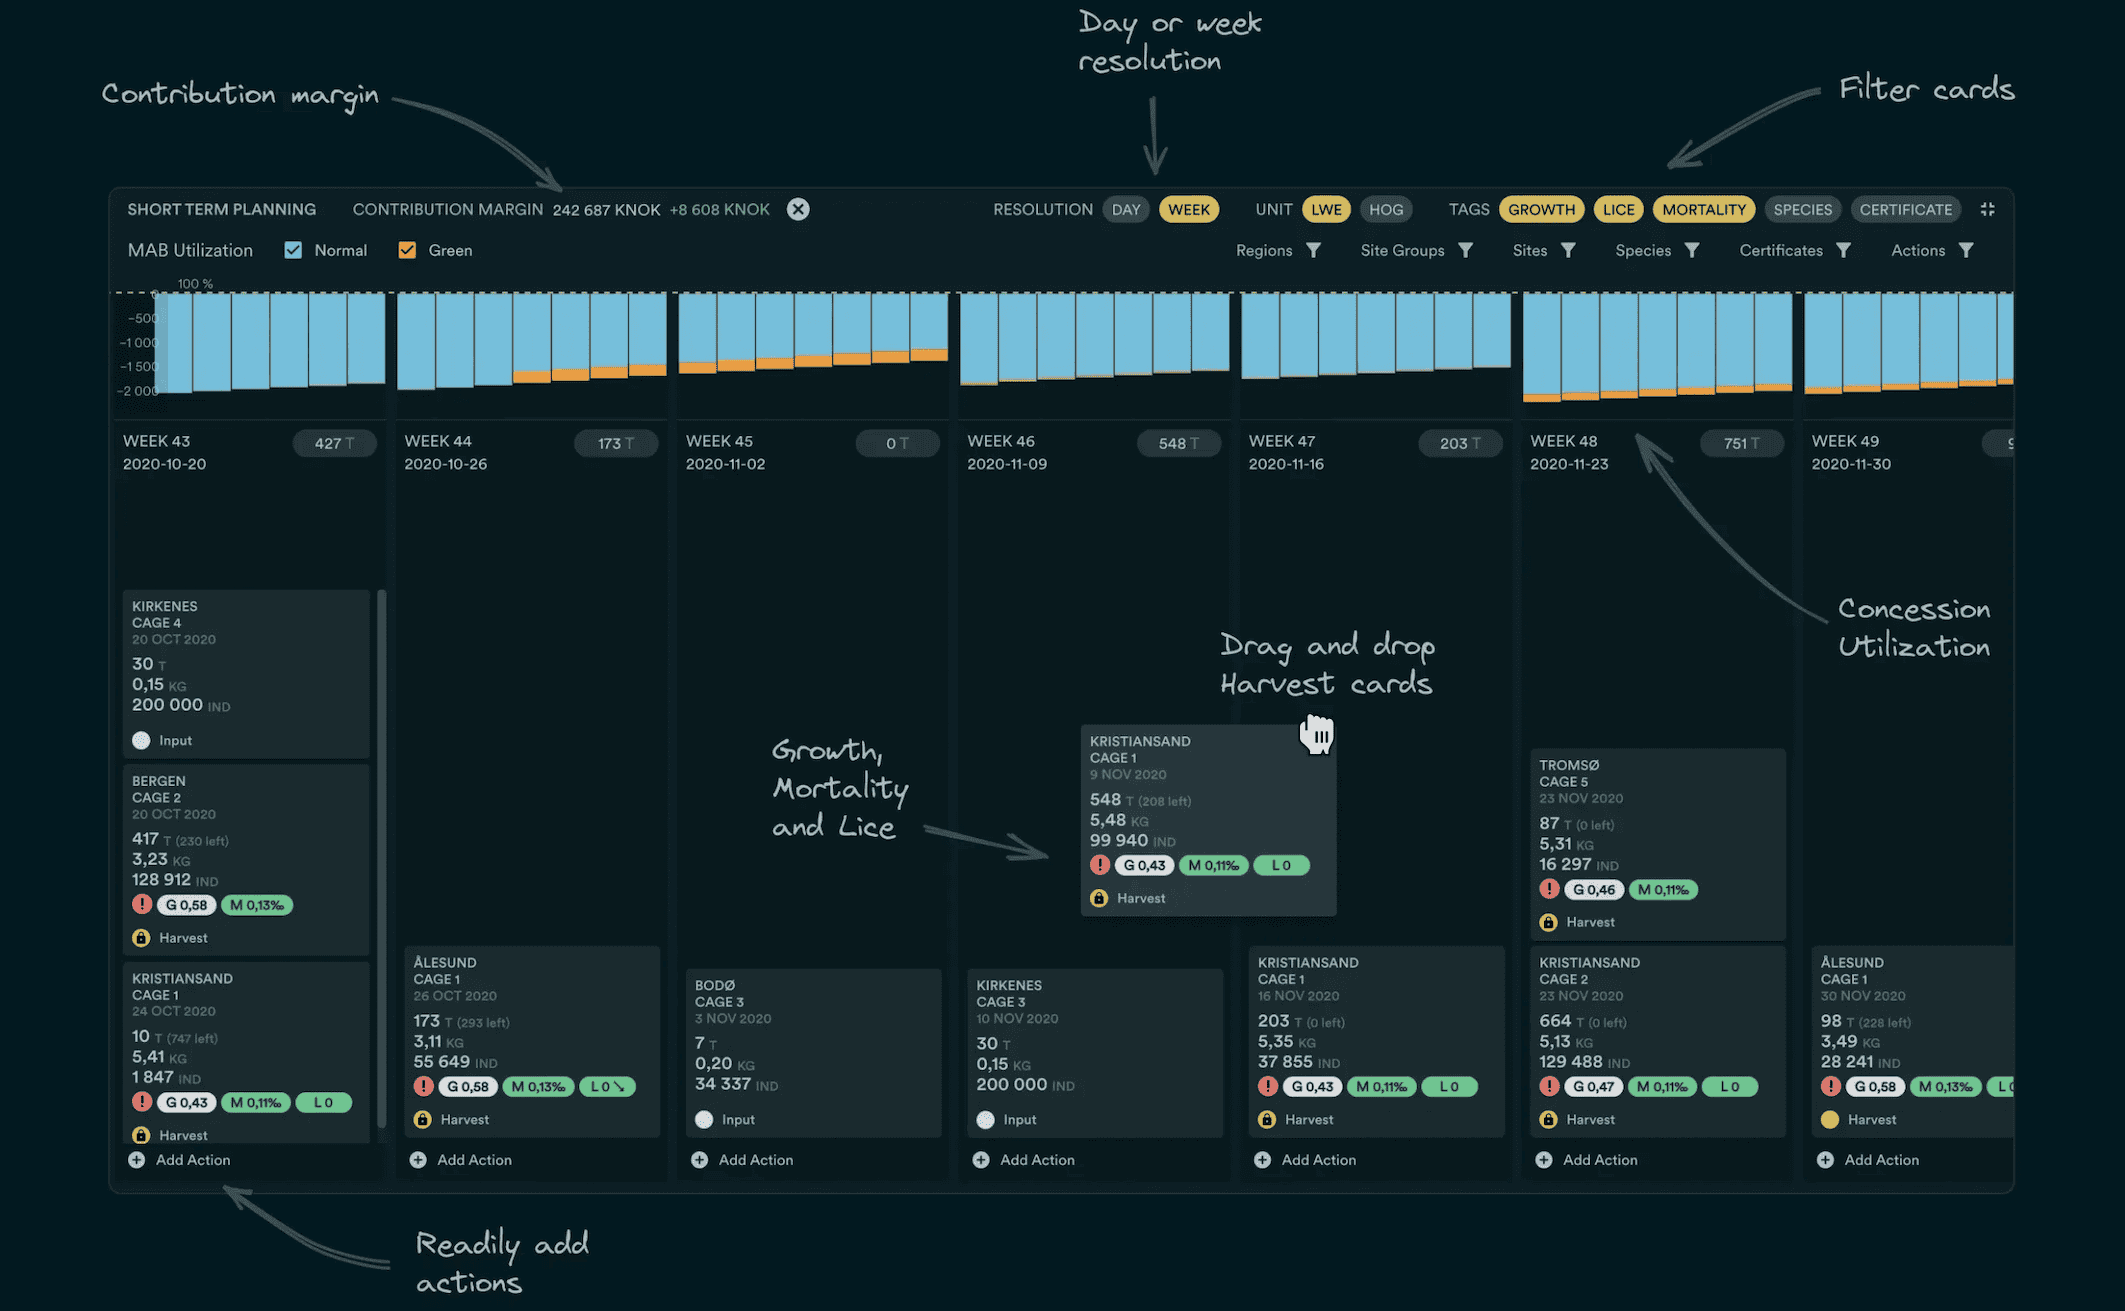
Bioplan is our decision-support tool that combines real-time data from the bioscope with production forecasts. It means fewer surprises and better control – all the way to harvest.
✓
Plan the harvest timingBased on actual weight development and quality.
✓
Forecast the superior shareIdentify where downgrading occurs and prioritize the right groups.
✓
Better capacity utilizationA complete overview of groups and growth enables smarter planning.
✓
Quick decisionsContinuously updated figures that reflect the reality in the cage.

Validated against reality
The estimates are tested against actual harvest results and are continuously improved as more data comes in. This means that the figures reflect the reality of production – and provide a precise basis for decision-making when margins matter most. When margins are small, this tool is big.
